Tag Archives: matt swartz

You’re Wrong; No, You Are!

As I’ve mentioned before, the comments section of the Hardball Times is a barren wasteland. But Matt Swartz’s latest treatise on being an idiot with a stats software package attracted some controversy, mostly because he’s an idiot with a stats software package. I’ve archived the SABR fight in case the comments disappear as things sometimes do on THT. And I’ve even highlighted the best parts.

Mike Fast:

The community has shown with certainty that there is little difference between pitchers? I would say that my study of HITf/x data indicated exactly the opposite.

And similarly for team defensive efficiency, a large portion of it is due to how hard the team’s pitchers allow the ball to be hit.

Single-year BABIP is a crude measure of pitcher skill, and it’s leading you to conclusions about the game of baseball that are very wrong.

Matt Swartz:

I’m not coming to any wrong conclusions. I don’t know what you think I’m doing with single season BABIP, but it’s not leading myself to wrong conclusions.

There IS little difference relative to the difference between pitchers in strikeout rate, which is why it takes more than a season to stabilize.

What your study showed was that how hard balls are hit is persistent, and that it is correlated with BABIP. It didn’t widen the spread of pitcher BABIP skill levels in the MLB, which is and always has been minimal compared to the spread in strikeout rates.

I find your comment about “leading you to conclusions about the game of baseball that are very wrong” to be fantastically indicative that you haven’t really read and understood this or anything else I’ve written on the topic of pitcher BABIP. If you did, you could certainly understand your own findings better, and you’d know they aren’t contradictory.

The reason that single season BABIP is a crude indicator of pitcher skill is sample size. The variance in an individual’s BABIP skill level due to randomness is going to be about [.21/sqrt(number of batted balls)]. Knowing this, we can actually pin down that about 75% of single season BABIP variance is due to luck for pitchers with >=150 IP. The rest of it comes down to know the other 25%. We know that regressing team BABIP by the same process would yield another 13% of the variance in BABIP, which means that there is 12% for pitching.

Using single season BABIP to understand that 12% will due a pretty poor job. However, using peripherals and running a regression as I have will eliminate a lot of that noise. In fact, you can explain about 10.4% of that 12% by knowing peripherals. What your study likely did is duplicated some of the effort in understanding the first 10.4% (hard hit balls or correlated with peripherals; check your data, I’m sure it’s true) and supplemented a good portion of the remaining 1.6%.

In other words, nothing you found negates anything I’ve found at all. You’ve come up with a way to use propietary data effectively. Unless you have that available, using peripherals does a pretty good job. I can’t even imagine what it is that you disagree with here, or what you think I don’t understand.

MF:

I’m not disputing your statistics. I’m disputing your conclusions about the game of baseball.

“What your study showed was that how hard balls are hit is persistent, and that it is correlated with BABIP. It didn’t widen the spread of pitcher BABIP skill levels in the MLB, which is and always has been minimal compared to the spread in strikeout rates.”

Right. But I did show that BABIP is a poor way to measure pitcher skill. We sorta knew that already, but some people had taken the BABIP findings to mean that pitcher skill was also minimal. I established that that conclusion from the evidence was wrong.

You are correct that strikeout rate picks up some of the hard-hit ball skill that pitchers have. However, it does not pick up nearly all of it.

Moreover, batted ball categories are pretty good at picking up vertical launch angle effects, but they are lousy at picking up how hard the ball is it.

So your regressions are still missing some pretty important data.

Yes, the ways we have found to measure that data so far are proprietary. That doesn’t mean that we shouldn’t learn about the reality of baseball from that data and let that effect how we frame questions, though. I would certainly wonder why BABIP doesn’t better reflect how hard the ball is hit.

I found that almost half of team BABIP was due to how hard the ball was hit. So when you say it’s 12 percent pitching skill, that’s what I’m disputing. You could say that you can only detect that 12 percent of the team BABIP is due to the pitchers, but it’s a leap of logic to say that you’re looking at pitching SKILL there. And HITf/x data indicates in fact that you are not.

Also, I don’t understand why you insist on looking at single-season pitcher/team BABIP to determine that number. It is simpler to calculate, but it’s deceptive. Being rooted to single-season numbers is one of the big failings of modern sabermetrics.

MS:

Which of my conclusions about the game of baseball do you dispute?

You found that how hard a ball is hit is highly correlated. This is a self-contained statistic that is only useful inasmuch as it can teach you about singles, doubles, triples, home runs, outs, and errors. It doesn’t do me any good to know the statistic otherwise, except for how it relates to outcomes that affect games. So BABIP is a logical skill to try to infer from how hard a ball is hit, and your numbers do a nice job of hitting on that.

I think when you say “half of BABIP was due to how hard the ball was hit,” you’re either using same year data or R instead of R^2 or doing both. I’m guessing you’re doing correlations, while I’m doing R^2.

But if it’s just same year data, you’re including luck in terms of how hard a ball was hit (of course pitchers will deviate around their true talent rate in this category as well). That doesn’t measure skill. That measures outcomes.

My regressions are not intended to be the end-all summary of a pitcher’s true BABIP skill. They pick up about 80% of the possible variance that could exist in BABIP skills.

Since this seems to be a point of contention—how much variance in true BABIP skill there is to find—I’ll prove to you that R=0.5 or even R^2=.25 is insane for one season of data.

Take all pitchers with 150 IP or more in a single season from 2003-2011. They average 592 BIP. There true BABIP skill is about .30, give or take, so the variance in luck HAS to be .21/592 for the average pitcher in this group. It’s impossible binomially for that not to be true. That’s a random variance if .000354. The actual variance in BABIP for that same group is .000457. That means randomness HAS to explain 77% (last time I got 75% but same diff)! I don’t know how much you think is team defense, but you’re it’s not 0%. If you look at how much variance is explainable by defense seriously, it’s about 13%. That’s just regressing the data.

So my original 12% number is the maximum explainable by differences between pitchers. That’s not what my regressioun found. That was 10.4%. Obviously give or take here or there, but you get the point. Most of it is explained by peripherals.

And just because you’re saying I’m looking at single-season numbers to prove that point, that has nothing to do with the implications of that 12%. The 12% means the standard deviation is pitcher skill is about .007 of BABIP. It can’t be much greater than that, and it has nothing to do with choosing a single season. The same analysis on careers or half seasons or whatever would give you about the same conclusion. I look at single-season because it’s the easiest to run these tests on quickly.

So what exactly do you think are my wrong conclusions? Where in that description of variance will you determine that BABIP skill level has a higher spread than about .007, and where as about .005 or .006 can be explained by a regression on peripherals, tell me what’s wrong here. If you want to say there is value in the last .001 or .002, great, keep at it. It may only be attainable with propietary data, and good for you if you can use it to your advantage. But nothing that I have found here is wrong.

And there it ends, without even a snide remark from Fast on Twitter. I feel like Matt Swartz took Nate Silver’s Baseball Prospectus columns a little too much to heart.

Re-Explaining DIPS, Vol. 1

In this new series, I will highlight one of my least favorite SABR tropes, starting off an article by name-dropping Voros McCracken and explaining DIPS. First off, Matt Swartz in his recent, three-tabled article, “Adjusting defense efficiency by the quality of pitching“:

Fausto Carmona throws a hard sinker on the outside corner, but Ichiro Suzuki turns it into a well-struck ground ball by going the other way, splitting the defenders on the left side of the diamond. We know who should get credit for the single on the Mariners’ side of the box score—there was only one guy with a bat. But who on the Indians will take the blame for the single? Is it Carmona who made the pitch, or the defenders who could not get to the ball fast enough?
Bill James invented Defensive Efficiency, measuring the percentage of balls in play that a defense turns into outs. It became apparent just how useful this would be for evaluation of team defense when Voros McCracken famously concluded that, “There is little if any difference among major-league pitchers in their ability to prevent hits on balls hit in the field of play.” A natural corollary to this thesis says that to measure team defense, one should use Defensive Efficiency rate.

Baseball Prospectus Disowns the Idiot with the Stats Software Package

No doubt inspired by my comments on Matt Swartz’s harebrained relaunch of SIERA, Colin Wyers officially called out Swartz for his shoddy work and ignorance of statistics. It’s awesome, really. I’m not being ironic when I say it’s exactly what sabermetrics should be. And he managed to do it in 3,000 words, instead of the millions Swartz has written so far about his idiotic stat. I’ll link it again for everyone; please go read Wyers’s article.

One Idiot with a Stats Software Package

if tRA is FIP having a nightmare SIERA is giving two idiots a stats software package and telling them not to ask questions

Just when you thought this blog was dead and buried, Matt Swartz comes riding to the rescue. At FanGraphs, he has a new five-part series on everyone’s favorite stat, SIERA. Because last time around, as Swartz trumpets, he and his partner in stupidity crime, Eric Seidman, “didn’t totally appreciate why it worked.” And the name “skill interactive” was completely misleading, too. It’s not like you two devoted more than 10,000 words and its own five-part introductory series on Baseball Prospectus about it last winter. This time, though, Swartz has totally got this.

He isn’t shying away, though. He answers the questions SIERA-atics (like myself) have often asked, like, “Why aren’t there more terms in this equation?” To which he says, in Part Two, “Excellent question. I’ve added (BB/PA)^2, (SO/PA)*(BB/PA), a run-environment variable, and percentage of innings as a SP! And all only because they improve my RMSE!” Swartz even managed to flip the sign on one of the preexisting terms with no explanation why.

I don’t know anything about FanGraphs’ business, but bringing on Matt Swartz and letting him revamp SIERA has to be a waste of money. A one-percent improvement over xFIP would be valuable to a team, I imagine, but to the average fan, it’s worth zero. Maybe less than zero when it’s impossible to explain in English the rationale for the stat.  (Though we’ll have to wait until Part Four to see the comparison between the two, I wouldn’t bet the improvement is close to one percent. And there’s always a good chance that the comparisons aren’t done correctly anyway.) So they’re paying Swartz to blather on about something pointless at best and wasting Dave Appelman’s time in having to add it to their database. The rich grandpa lives on.

Somewhat surprising to me is that the FanGraphs commenters are being uncharacteristically kind to Swartz and his Frankenstein stat. Baseball Prospectus commenters, less so.

Predicting Strikeouts with Wh- zzzzz…

In his article today throwing down the gauntlet against FanGraphs (and their Swartzianly-boring writers), Matt Swartz penned some of his finest prose yet:

For every one percentage point above average in the previous year’s strikeout rate, the following year’s strikeout rate is likely to be about 0.73 percentage points above average. However, for pitchers with the same strikeout rate the previous year, a pitcher with one percentage point higher swinging-strike rate only will have a 0.12 percentage point higher strikeout rate, which is not statistically significant.

Fascinating!

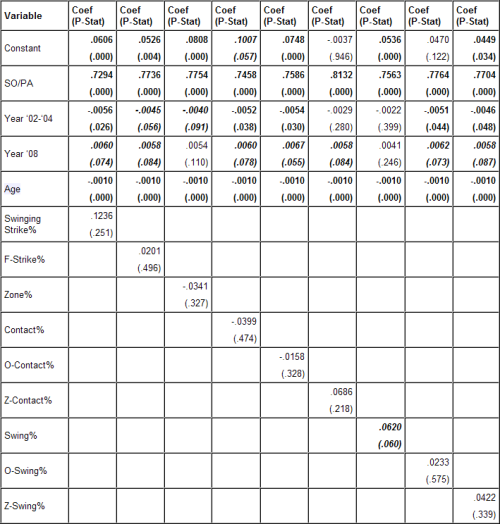
He even included six really killer tables, including something I can only call a Super Table:

The Super Table

Even more fascinating!

But then Tango had to go and kind of spoil the fun.

Anyway, BP was really strong today, as Will F**king Carroll led with “One of the hardest things I have to do is explaining [sic] what I do.” How about something like, “I write about sports injuries”? But that wouldn’t capture that certain je ne sais quoi of Under The Knife.

He went on to say, “The outright arrogance of some statheads and the inability to market any of the tools they’ve developed have held things back.” Can’t… write… irony… too great.

Ahead in the Count: Tabling the Discussion

Nobody loves tables quite as much as Baseball Prospectus’s Matt Swartz, so I decided to make my own. Go look at it. Please.

Swartz had written for other sites before, but BP is the grandest stage of them all. I think now is a good time to look back and remember the very first table Swartz published on Baseball Prospectus. On May 19, 2009, in his submission article to that hilarious trainwreck, Prospectus Idol, we saw:

Player 1/Player 2    Deny   Confess
Deny                -3,-3    -15,-2
Confess             -2,-15   -10,-10

It’s beautiful.

Matt Swartz Engaged in Twitter War with Unwashed Masses

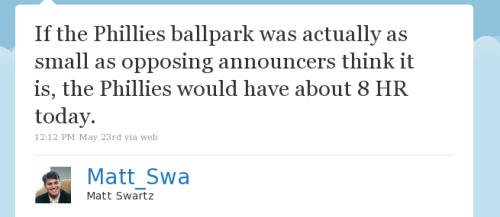
If the Phillies ballpark was actually as small as opposing announcer think it is, the Phillies would have about 8 HR today.

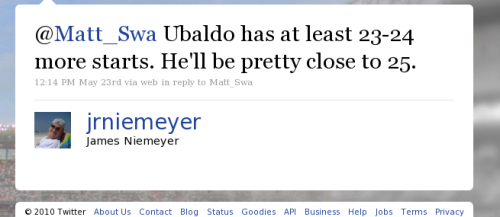
@Matt_Swa Ubaldo has at least 23-24 more starts. He'll be pretty close to 25.

Wait, just to clarify, you think Ubaldo Jimenez will win close to 25 games? Bc you think he can win 17 of 24 starts? Clarify?

@Matt_Swa We need to define "close". I don't think its inconceivable that Ubaldo wins 22-23.

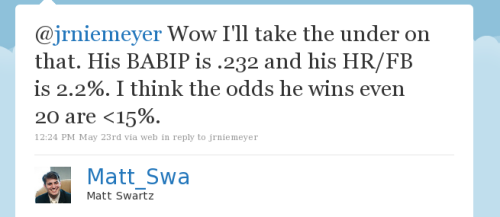
@jrniemeyer Wow I'll take the under on that. His BABIP is .232 and his HR/FB is 2.2%. I think the ods he wins even 20 are <15%.

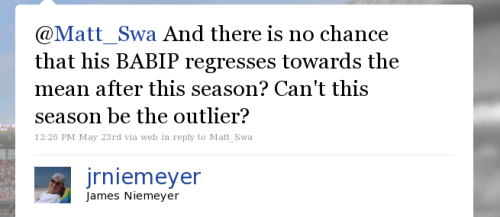
@Matt_Swa And there is no chance that his BABIP regresses towards the mean after this season? Can't this season be the outlier?

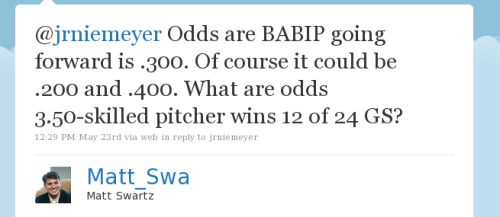
@jrniemeyer Odds are BABIP going forward is .300. Of course it could be .200 and .400. What are odds 3.50-skilled pitcher wins 12 of 24 GS?

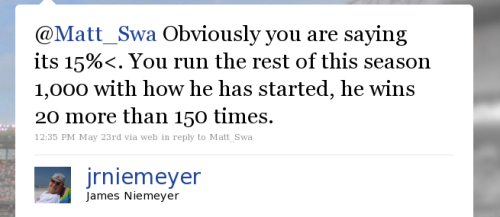
@Matt_Swa Obviously you are saying its 15%<. You run the rest of this season 1,000 with how he has started, he wins 20 more than 150 times.

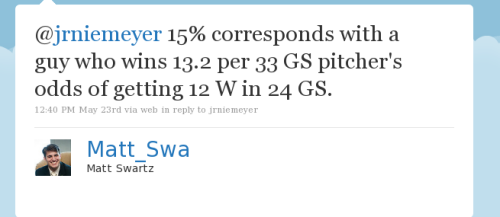
@jrniemeyer 15% corresponds with a guy who wins 13.2 per 33 GS pitcher's odds of getting 12 W in 24 GS.

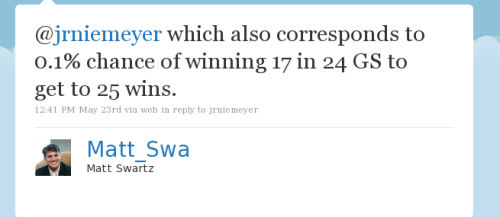
@jrniemeyer which also corresponds to 0.1% chance of winning 17 in 24 GS to get 25 wins.

@Matt_Swa Those numbers only apply in a vacuum. Feels like you are failing to take into account progression and current year.

@jrniemeyer What do you mean a vacuum? His SIERA is about the same as last year. How good do you think he is now?

@Matt_Swa Not to mention, his last 22 starts of last year? 12 wins. He has to do less that this year...and presumably he is better.

@Matt_Swa (Regular season)

@jrniemeyer So lucky before in one way, lucky this year another way. So throw out all we know about science and baseball in one swoop.

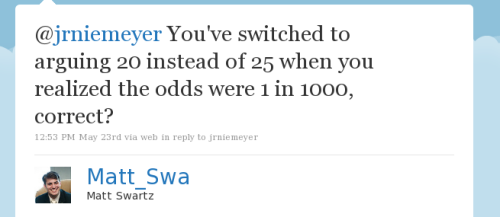
@jrniemeyer You've switched to arguing 20 instead of 25 when you realized the odds were 1 in 1000, correct?

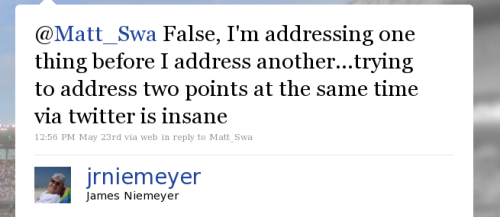
@Matt_Swa False, I'm addressing one thing before I address another...trying to address two points at the same time via twitter is insane.

@Matt_Swa I also never said he would win 25..I said close...which we never defined.

@jrniemeyer You're correct that you are dodging the ball. You did disagree with 15% chance of winning 20, which I showed my work. Show yours

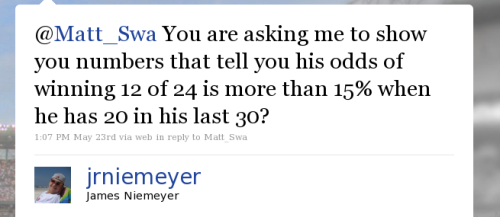
@Matt_Swa You are asking me to show you numbers that tell you his odds of winning 12 of 24 is more than 15% when he has 20 in his last 30?

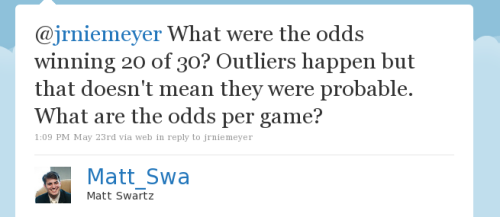
@jrniemeyer What were ths odds of winning 20 of 30? Outliers happen but that doesn't mean they were probable. What are the odds per game?

@jrniemeyer People who don't understand statistics just assume past outcomes repeat. Does this sound like you or not?

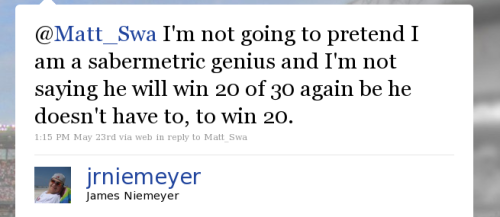
@Matt_Swa I'm not going to pretend I am a sabermetric genius and I'm not saying he will win 20 of 30 again be he doesn't have to, to win 20.

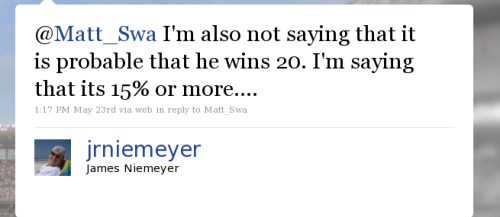
@Matt_Swa I'm also not saying that it is probable that he wins 20. I'm saying that its 15% or more....

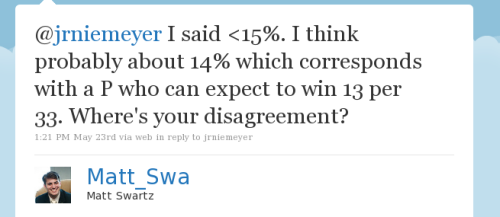
@jrniemeyer I said <15%. I think probably about 14% which corresponds with a P who can expect to win 13 per 33. Where's your disagreement?

@Matt_Swa I know just enough about Prob/Stats to make me look stupid. I also think we aren't on the same page.

@Matt_Swa He's won 46% of his last 76 games. Is that too small of a sample size for ?(not being a smart ass, seriously asking)

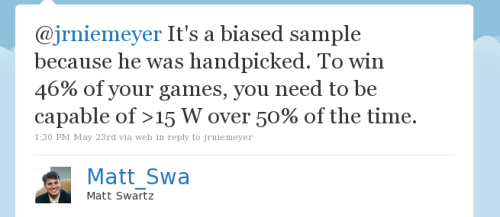
@jrniemeyer It's a biased sample because he was handpicked. To win 46% of your games, you need to be capable of >15 W over 50% of the time.

@jrniemeyer Look for a list of pitchers who have won 46% of games in 76 game spans. Does Ubaldo fit?

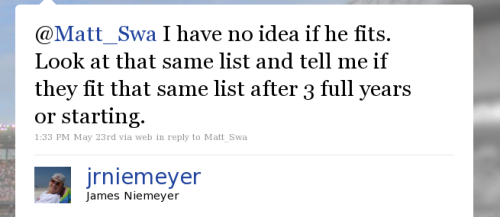
@Matt_Swa I have no idea if he fits. Look at that same list and tell me if they fit that same list after 3 full years of starting.

@Matt_Swa Essentially you are saying is that 82% of his career starts are not the norm....I don't know how to argue against that.

@jrniemeter You handpicked a player that is most extreme in a luck category and are carrying his numbers forward.

@jrniemeyer W luck-based in the first place. I don't even know why you dropped the other 18% of his starts. This is all so cherry picked.

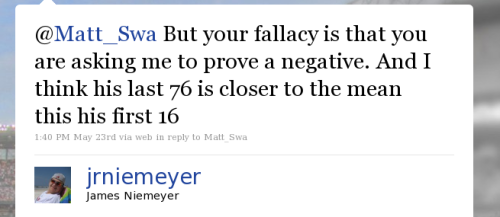
@Matt_Swa But your fallacy is that you are asking me to prove a negative. And I think his last 76 is closer to the mean this his first 16

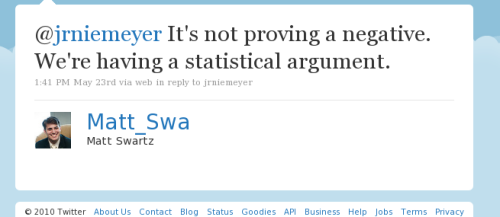
@jrniemeyer It's not proving a negative. We're having a statistical argument.

@Matt_Swa You are asking me to prove that something will happen that is already happening....I don't know how to do that.

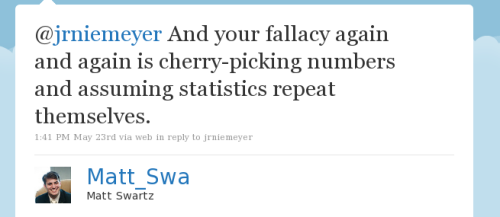
@jrniemeyer And your fallacy again and again is cherry-picking numbers and assuming statistics repeat themselves.

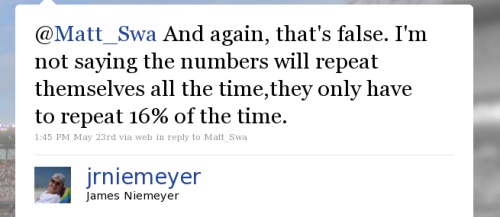
@Matt_Swa And again, that's false. I'm not saying the numbers will repeat themselves all the time,they only have to repeat 16% of the time.

@Matt_Swa And do me a favor...you tell me when his numbers will stop repeating themselves and the rate of decline in which that will occur.

@jrniemeyer Regardless, you are saying that I'm way off in saying Ubaldo wins 13 per 33 GS. You also have no sense of why you disagree.

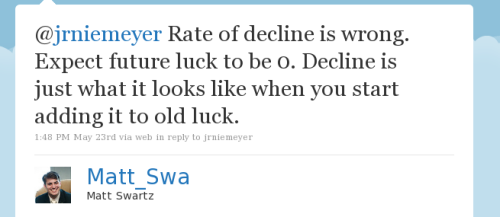
@jrniemeyer Rate of decline is wrong. Expect future luck to be 0. Decline is just what it looks like when you start adding it to old luck.

@Matt_Swa Fine, we'll take it point by point. 13 per 33 is wrong. That's 39%. He has 39 wins in 92 starts. That's 42%.

@Matt_Swa It's close to 14 wins than it is 13. And since we are arguing % pts, that makes a difference.

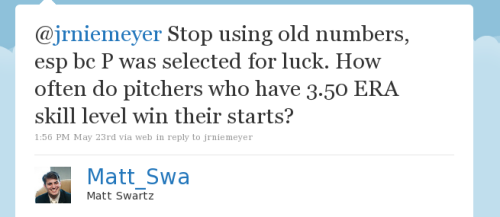
@jrniemeyer Stop using old numbers, esp bc P was selected=

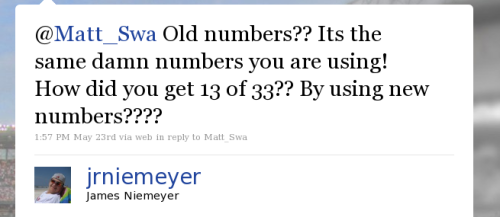
@Matt_Swa Old numbers?? It's the same damn numbers you are using! How did you get 13 of 33?? By using new numbers????

@jrniemeyer Because I know about how often pitchers with 3.50 ERA skill win 13 games. Look at preseason projections.

@jrniemeyer PECOTA had him at 13, CHONE at 11, ZIPS at 14. That's because that's the expected win total of pitchers his caliber.

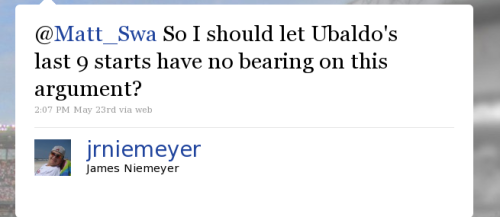
@Matt_Swa So I should let Ubaldo's last 9 starts have no bearing on this argument?

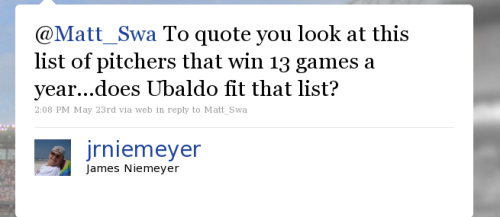
@Matt_Swa To quote you look at this list of pitchers that win 13 games a year...does Ubaldo fit that list?

@Matt_Swa (Look at A list...not "this" list) sry.

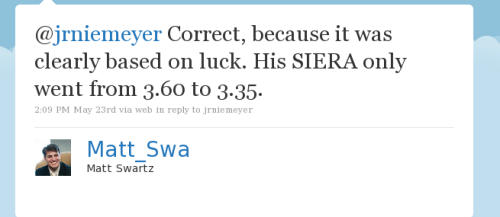
@jrniemeyer Correct, because it was clearly based on luck. His SIERA only went from 3.60 to 3.35.

@jrniemeyer j.santana, e.jackson, k.millwood, y.gallardo, j.danks, m.buehrle, j.niemann, a.burnett, r.romero, r.nolasco. about right?

@Matt_Swa My argument is that this is his outlier year....I don't think he will keep this pace up for his career.

@jrniemeyer And that's my point. You are assuming luck persists into future. Old luck happened. New luck should be assumed to be zero.

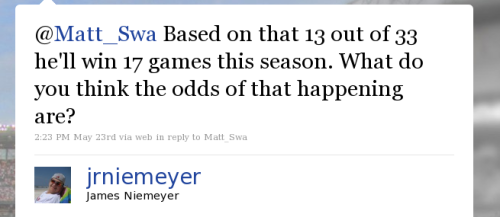
@Matt_Swa Based on that 13 out of 33 he'll win 17 games this season. What do you think the odds of that happening are?

@jrniemeyer about 50%

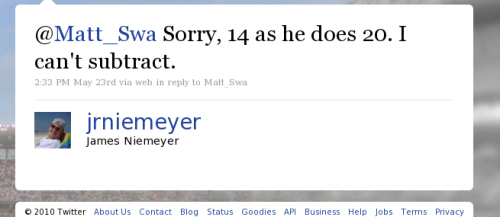
@Matt_Swa Sorry, 14 as he does 20. I can't subtract.

@jrniemeyer yes.

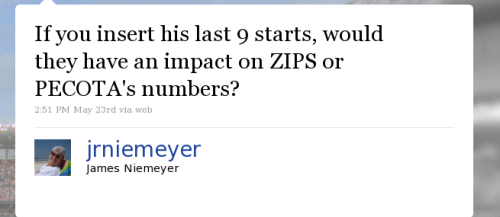
If you insert his last 9 starts, would they have an impact on ZIPS or PECOTA's numbers?

Because even if you use ZIPS numbers without the past 9 starts UJ should still win 18, 50%. I don't think 2 wins should drop it 35%.

@jrniemeyer Since his DIPS stats did not change, I really doubt it.

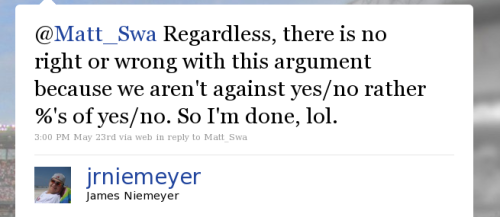
@Matt_Swa Regardless, there is no right or wrong with this argument because we aren't against yes/no rather %'s of yes/no. So I'm done, lol.

@Matt_Swa But I appreciate you taking the time to argue this with me even if you do think I'm misinformed. Sabermetrics is a little rough...